A Quantitative Analysis of the Effects of a Residential Experience

Research carried out at Castlerigg Manor in the summer term of 2008

Developmental Impact and Participants’ Positivity Distributions

Average of all samples


Developmental Impact

Developmental Impact Index: 49%

Graph of the distribution of Developmental Impact indices
Graph of distribution of developmental impact on individuals
Percentage expressing at least a given impact rating
Graph of distribution of positivity of individuals

Participants’ Overall ‘Positivity’

Overall Positivity Factor 55%

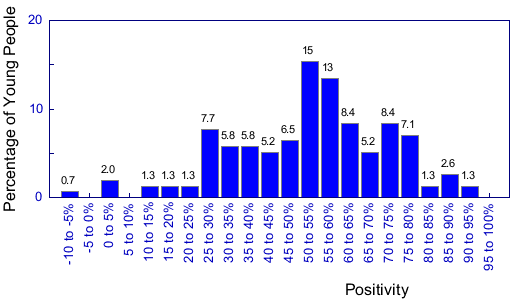
Graph of the Distribution of Positivity Factors
Graph of distribution of positivity of individuals
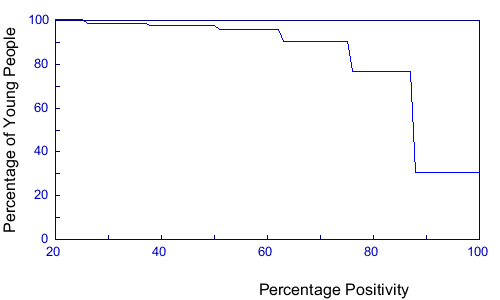
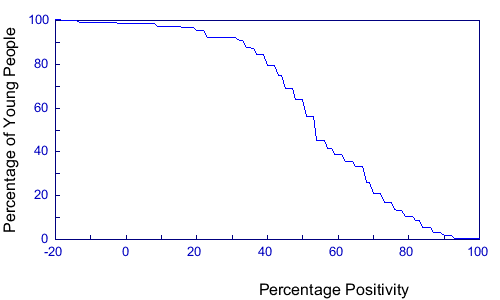
Percentage expressing at least a given positivity
Graph of distribution of positivity of individuals

Participants’ ‘Positivity’ in Questions about Reactions to the Course

Reactions to the Course Positivity Factor 85%

Graph of the Distribution of Positivity Factors
Graph of distribution of positivity of individuals
Percentage expressing at least a given positivity
Graph of distribution of positivity of individuals

Participants’ ‘Positivity’ in Questions about Personal Development

Personal Development Positivity Factor 52%

Graph of the Distribution of Positivity Factors
Graph of distribution of positivity of individuals
Percentage expressing at least a given positivity
Graph of distribution of positivity of individuals

Participants’ ‘Positivity’ in Questions about Social Development

Social Development Positivity Factor 54%

Graph of the Distribution of Positivity Factors
Graph of distribution of positivity of individuals
Percentage expressing at least a given positivity
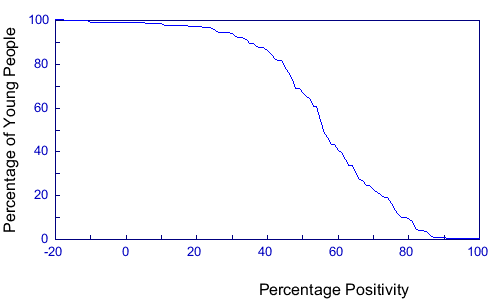
Graph of distribution of positivity of individuals

Participants’ ‘Positivity’ in Questions about Spiritual Development

Spiritual Development Positivity Factor 43%

Graph of the Distribution of Positivity Factors
Graph of distribution of positivity of individuals
Percentage expressing at least a given positivity
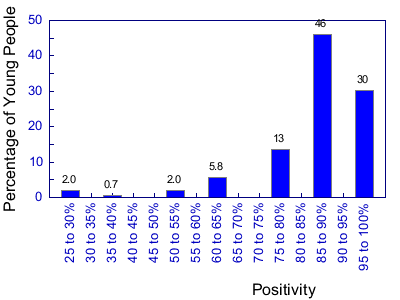
Graph of distribution of positivity of individuals