A Quantitative Analysis of the Effects of a Residential Experience
Research carried out at Castlerigg Manor in the summer term of 2008
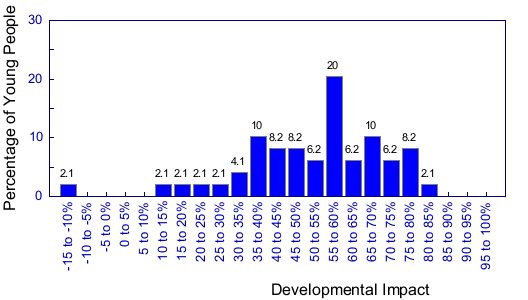
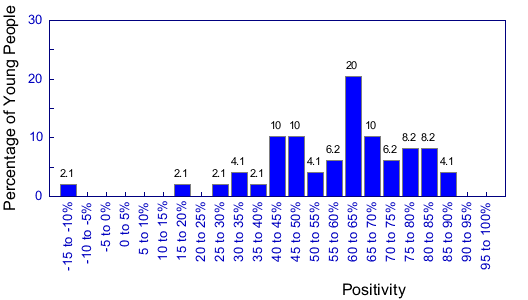
Developmental Impact and Participants’ Positivity Distributions
Sample C
Developmental Impact
Percentage expressing at least a given impact rating
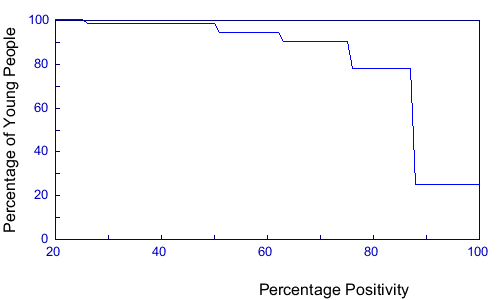
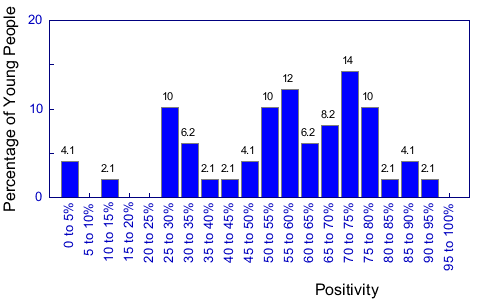
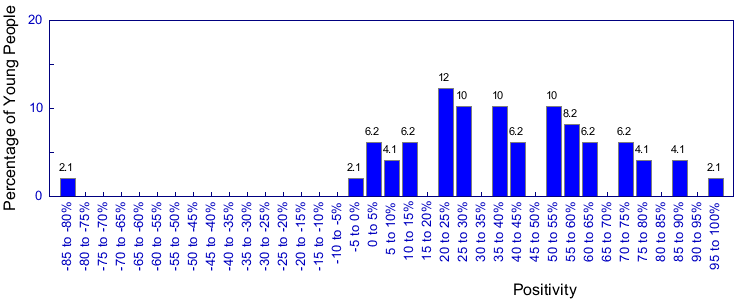
Graph of the Distribution of Positivity Factors
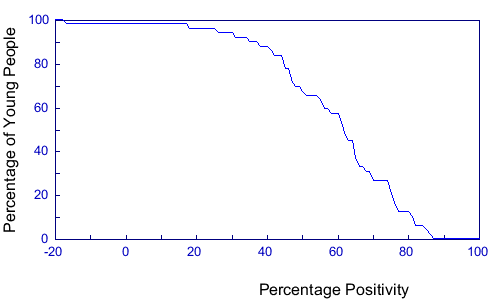
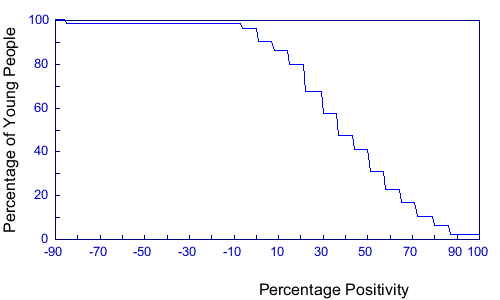
Percentage expressing at least a given positivity
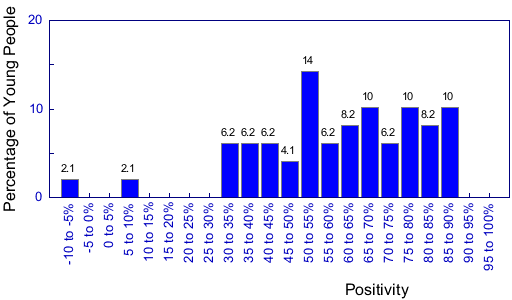
Graph of the Distribution of Positivity Factors
Percentage expressing at least a given positivity
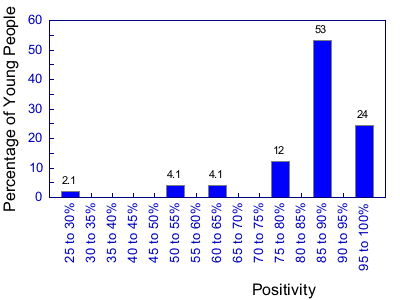
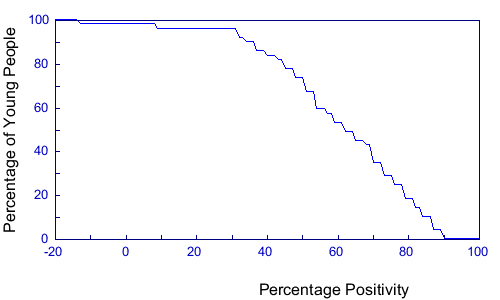
Graph of the Distribution of Positivity Factors
Percentage expressing at least a given positivity
Graph of the Distribution of Positivity Factors
Percentage expressing at least a given positivity
Graph of the Distribution of Positivity Factors
Percentage expressing at least a given positivity