A Quantitative Analysis of the Effects of a Residential Experience
Research carried out at Castlerigg Manor in the summer term of 2008
Data relating to Question 9:
Are you better or worse at speaking in front of others?
Grouping(s)
Answers
| Pie Chart | Positivity | no answer | much worse | worse | the same | better | much better | |
| Average | 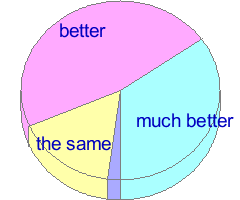 | 49.36% | 0.00% | 0.64% | 3.85% | 18.59% | 50.00% | 26.92% |
| Sample A | | 52.17% | 0.00% | 2.17% | 4.35% | 13.04% | 47.83% | 32.61% |
| Sample B | | 40.98% | 0.00% | 0.00% | 4.92% | 24.59% | 54.10% | 16.39% |
| Sample C | | 57.14% | 0.00% | 0.00% | 2.04% | 16.33% | 46.94% | 34.69% |
Consistency
Answer Correlation Data
- An insignificant number (0.64%) answered ‘much worse’
- Other answers given by the 3.85% who answered ‘worse’
- Other answers given by the 18.59% who answered ‘the same’
- Other answers given by the 50.00% who answered ‘better’
- Other answers given by the 26.92% who answered ‘much better’
Coefficients of Determination between this and other Questions
| Coefficient of Determination | Question | |
| 12.08% | Q33 | Do you value yourself more? |
| 10.98% | Q8 | Are you better or worse at making decisions? |
| 10.92% | Q6 | Do you consider yourself to be a better or a worse person? |
| 9.62% | Q18 | Do you feel more or less likely to try out new things? |
| 9.56% | Q34 | Have you felt a sense of achievement this week? |
| 9.08% | Q22 | Are you more or less likely to take things for granted? |
| 8.63% | Q4 | Have you enjoyed new experiences this week? |
| 6.96% | Q7 | Do you know how to look after yourself better? |
| 6.50% | Q10 | Are you more or less trusting of others? |
| 6.38% | Q30 | Do you value working in a team more or less? |
| 6.33% | Q3 | Have you made new friends? |
| 6.08% | Q2 | Have you happy memories of the week? |
| 5.95% | Q12 | Do you respect others more or less? |
| 5.64% | Q15 | Do you think you are more or less likely to give others a chance? |
| 5.58% | Q35 | Do you feel you have changed? |
| 5.37% | Q5 | Have you a better or worse understanding of how others see you? |
| 5.37% | Q13 | Do you value others more or less? |