A Quantitative Analysis of the Effects of a Residential Experience
Research carried out at Castlerigg Manor in the summer term of 2008
Consistency of Samples
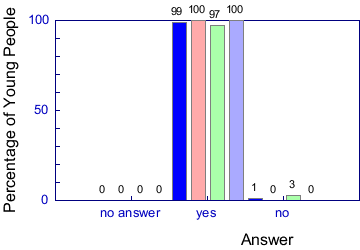
Question 1: I would like my answers to be included in Peter’s research
| Option | Average | Variance | St. Deviation |
| no answer | 0.00% | 0.00 | 0.00 |
| yes | 98.73% | 2.28 | 1.51 |
| no | 1.27% | 2.28 | 1.51 |
| Positivity Rating | 98.73% | 2.28 | 1.51 |
Question 2: Have you happy memories of the week?
| Option | Average | Variance | St. Deviation |
| no answer | 0.00% | 0.00 | 0.00 |
| none | 0.00% | 0.00 | 0.00 |
| a few | 10.90% | 12.56 | 3.54 |
| a lot | 89.10% | 12.56 | 3.54 |
| Positivity Rating | 94.55% | 3.14 | 1.77 |
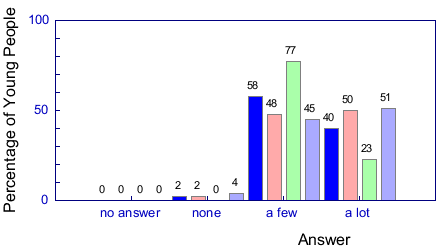
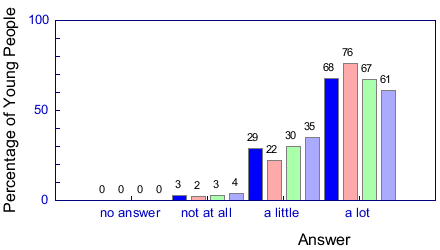
Question 3: Have you made new friends?
| Option | Average | Variance | St. Deviation |
| no answer | 0.00% | 0.00 | 0.00 |
| none | 1.92% | 2.81 | 1.68 |
| a few | 58.33% | 213.73 | 14.62 |
| a lot | 39.74% | 171.45 | 13.09 |
| Positivity Rating | 68.91% | 33.70 | 5.80 |
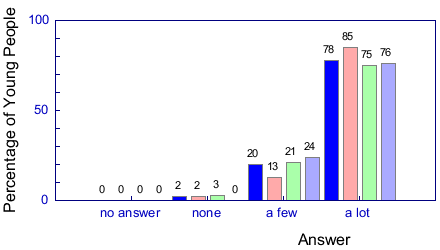
Question 4: Have you enjoyed new experiences this week?
| Option | Average | Variance | St. Deviation |
| no answer | 0.00% | 0.00 | 0.00 |
| none | 1.92% | 1.87 | 1.37 |
| a few | 19.87% | 23.34 | 4.83 |
| a lot | 78.21% | 19.45 | 4.41 |
| Positivity Rating | 88.14% | 4.82 | 2.20 |
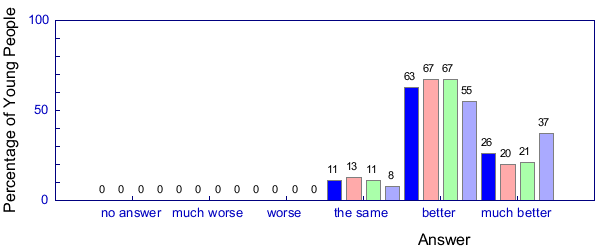
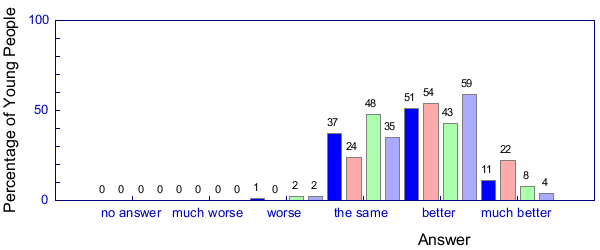
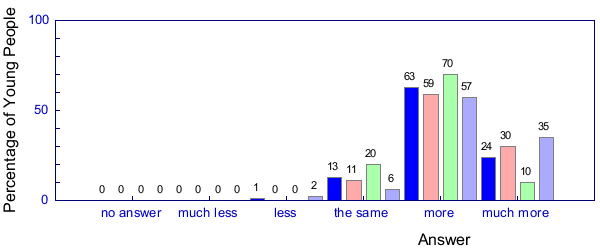
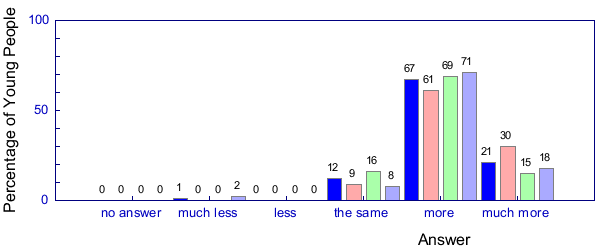
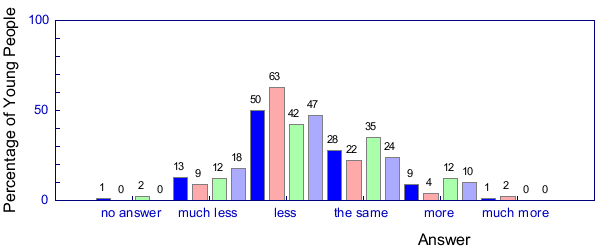
Question 5: Have you a better or worse understanding of how others see you?
| Option | Average | Variance | St. Deviation |
| no answer | 0.00% | 0.00 | 0.00 |
| much worse | 0.00% | 0.00 | 0.00 |
| worse | 0.00% | 0.00 | 0.00 |
| the same | 10.90% | 4.14 | 2.03 |
| better | 63.46% | 33.13 | 5.76 |
| much better | 25.64% | 59.58 | 7.72 |
| Positivity Rating | 57.37% | 23.57 | 4.86 |
Question 6: Do you consider yourself to be a better or a worse person?
| Option | Average | Variance | St. Deviation |
| no answer | 0.00% | 0.00 | 0.00 |
| much worse | 0.00% | 0.00 | 0.00 |
| worse | 1.28% | 0.78 | 0.88 |
| the same | 18.59% | 21.97 | 4.69 |
| better | 59.62% | 48.99 | 7.00 |
| much better | 20.51% | 49.00 | 7.00 |
| Positivity Rating | 49.68% | 23.65 | 4.86 |
Question 7: Do you know how to look after yourself better?
| Option | Average | Variance | St. Deviation |
| no answer | 0.00% | 0.00 | 0.00 |
| much worse | 0.00% | 0.00 | 0.00 |
| worse | 1.28% | 0.78 | 0.88 |
| the same | 36.54% | 94.62 | 9.73 |
| better | 51.28% | 48.94 | 7.00 |
| much better | 10.90% | 57.10 | 7.56 |
| Positivity Rating | 35.90% | 77.30 | 8.79 |
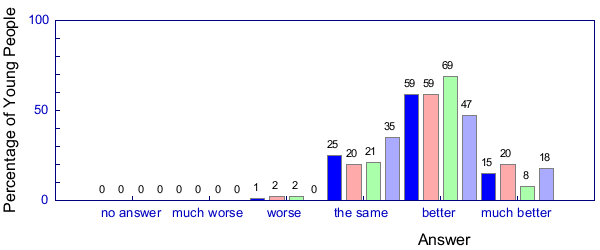
Question 8: Are you better or worse at making decisions?
| Option | Average | Variance | St. Deviation |
| no answer | 0.00% | 0.00 | 0.00 |
| much worse | 0.00% | 0.00 | 0.00 |
| worse | 1.28% | 0.86 | 0.92 |
| the same | 25.00% | 45.70 | 6.76 |
| better | 58.97% | 80.84 | 8.99 |
| much better | 14.74% | 26.41 | 5.14 |
| Positivity Rating | 43.59% | 8.07 | 2.84 |
Question 9: Are you better or worse at speaking in front of others?
| Option | Average | Variance | St. Deviation |
| no answer | 0.00% | 0.00 | 0.00 |
| much worse | 0.64% | 1.06 | 1.03 |
| worse | 3.85% | 1.55 | 1.25 |
| the same | 18.59% | 23.96 | 4.90 |
| better | 50.00% | 10.30 | 3.21 |
| much better | 26.92% | 67.86 | 8.24 |
| Positivity Rating | 49.36% | 46.22 | 6.80 |
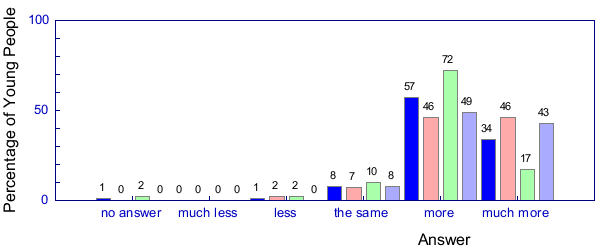
Question 10: Are you more or less trusting of others?
| Option | Average | Variance | St. Deviation |
| no answer | 0.00% | 0.00 | 0.00 |
| much less | 0.00% | 0.00 | 0.00 |
| less | 3.85% | 4.03 | 2.01 |
| the same | 16.67% | 82.65 | 9.09 |
| more | 61.54% | 2.79 | 1.67 |
| much more | 17.95% | 57.82 | 7.60 |
| Positivity Rating | 46.79% | 41.62 | 6.45 |
Question 11: Are you more or less self-conscious?
| Option | Average | Variance | St. Deviation |
| no answer | 0.00% | 0.00 | 0.00 |
| much less | 8.97% | 63.52 | 7.97 |
| less | 40.38% | 56.26 | 7.50 |
| the same | 34.62% | 82.46 | 9.08 |
| more | 12.82% | 41.12 | 6.41 |
| much more | 3.21% | 4.94 | 2.22 |
| Positivity Rating | 19.55% | 220.60 | 14.85 |
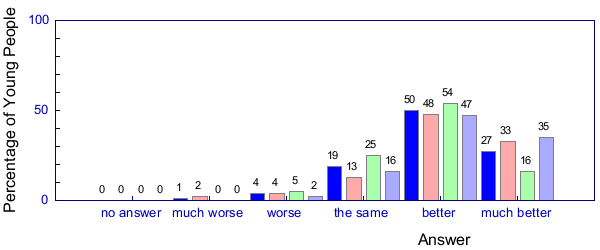
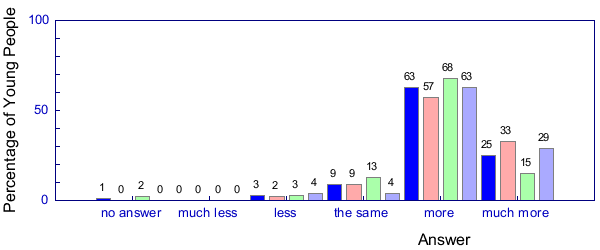
Question 12: Do you respect others more or less?
| Option | Average | Variance | St. Deviation |
| no answer | 0.00% | 0.00 | 0.00 |
| much less | 0.00% | 0.00 | 0.00 |
| less | 0.64% | 0.93 | 0.96 |
| the same | 12.82% | 31.87 | 5.65 |
| more | 62.82% | 36.03 | 6.00 |
| much more | 23.72% | 119.43 | 10.93 |
| Positivity Rating | 54.81% | 58.22 | 7.63 |
Question 13: Do you value others more or less?
| Option | Average | Variance | St. Deviation |
| no answer | 0.00% | 0.00 | 0.00 |
| much less | 0.00% | 0.00 | 0.00 |
| less | 0.64% | 0.93 | 0.96 |
| the same | 10.26% | 8.55 | 2.92 |
| more | 60.26% | 40.45 | 6.36 |
| much more | 28.85% | 69.22 | 8.32 |
| Positivity Rating | 58.65% | 22.03 | 4.69 |
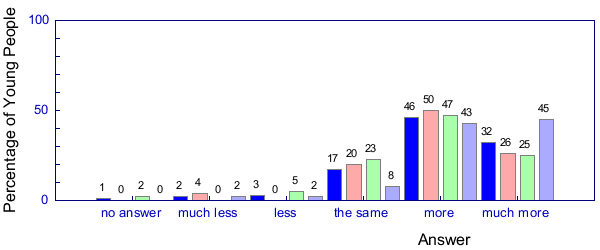
Question 14: Would you say your friendships with the friends you had before you came are more or less strong?
| Option | Average | Variance | St. Deviation |
| no answer | 0.65% | 0.63 | 0.79 |
| much less | 1.94% | 3.19 | 1.79 |
| less | 2.58% | 4.27 | 2.07 |
| the same | 17.42% | 41.75 | 6.46 |
| more | 46.45% | 8.52 | 2.92 |
| much more | 31.61% | 83.59 | 9.14 |
| Positivity Rating | 51.95% | 61.24 | 7.83 |
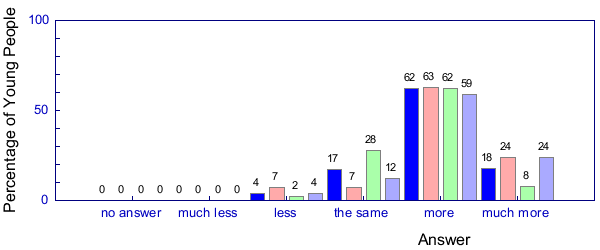
Question 15: Do you think you are more or less likely to give others a chance?
| Option | Average | Variance | St. Deviation |
| no answer | 0.65% | 0.63 | 0.79 |
| much less | 0.00% | 0.00 | 0.00 |
| less | 3.23% | 0.62 | 0.79 |
| the same | 9.03% | 14.37 | 3.79 |
| more | 63.23% | 23.68 | 4.87 |
| much more | 24.52% | 57.50 | 7.58 |
| Positivity Rating | 54.87% | 26.03 | 5.10 |
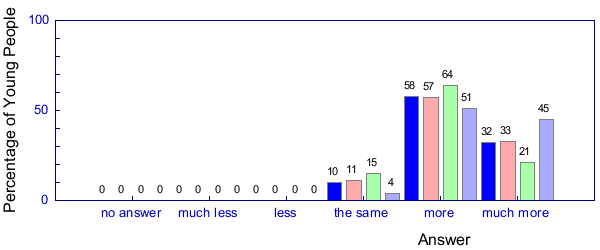
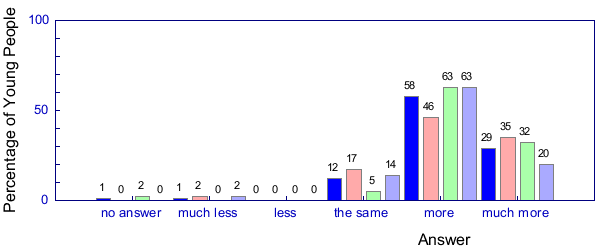
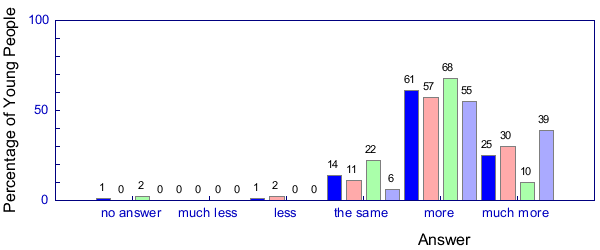
Question 16: Do you value spending time with others more or less?
| Option | Average | Variance | St. Deviation |
| no answer | 0.00% | 0.00 | 0.00 |
| much less | 0.00% | 0.00 | 0.00 |
| less | 0.00% | 0.00 | 0.00 |
| the same | 10.26% | 19.58 | 4.42 |
| more | 57.69% | 28.28 | 5.32 |
| much more | 32.05% | 93.56 | 9.67 |
| Positivity Rating | 60.90% | 49.50 | 7.04 |
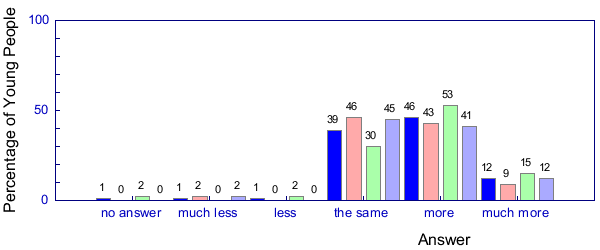
Question 17: Do you think you understand those around you more or less?
| Option | Average | Variance | St. Deviation |
| no answer | 0.00% | 0.00 | 0.00 |
| much less | 0.64% | 0.93 | 0.96 |
| less | 0.00% | 0.00 | 0.00 |
| the same | 11.54% | 14.35 | 3.79 |
| more | 67.31% | 20.27 | 4.50 |
| much more | 20.51% | 45.40 | 6.74 |
| Positivity Rating | 53.53% | 25.01 | 5.00 |
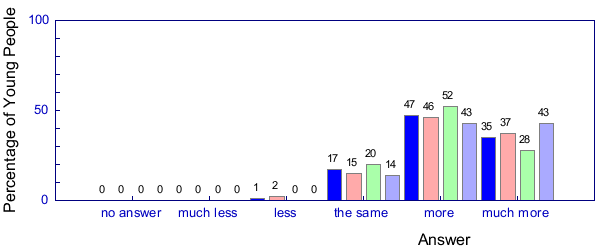
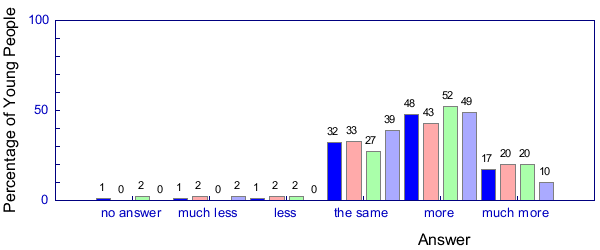
Question 18: Do you feel more or less likely to try out new things?
| Option | Average | Variance | St. Deviation |
| no answer | 0.00% | 0.00 | 0.00 |
| much less | 0.00% | 0.00 | 0.00 |
| less | 0.64% | 1.06 | 1.03 |
| the same | 16.67% | 5.60 | 2.37 |
| more | 47.44% | 16.46 | 4.06 |
| much more | 35.26% | 38.41 | 6.20 |
| Positivity Rating | 58.65% | 17.49 | 4.18 |
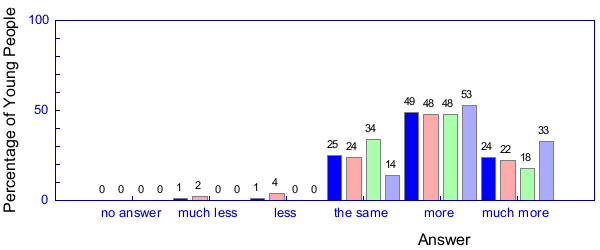
Question 19: Do you value people who are different from you more or less?
| Option | Average | Variance | St. Deviation |
| no answer | 0.00% | 0.00 | 0.00 |
| much less | 0.64% | 1.06 | 1.03 |
| less | 1.28% | 4.23 | 2.06 |
| the same | 25.00% | 68.28 | 8.26 |
| more | 49.36% | 6.45 | 2.54 |
| much more | 23.72% | 38.69 | 6.22 |
| Positivity Rating | 47.12% | 69.21 | 8.32 |
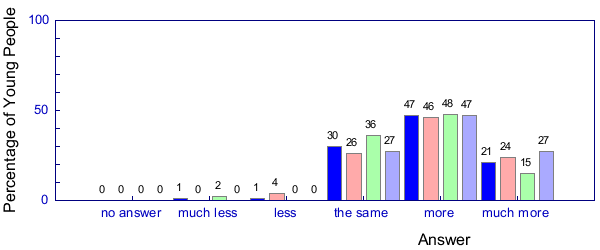
Question 20: Are you more or less concerned about equality in the world?
| Option | Average | Variance | St. Deviation |
| no answer | 0.00% | 0.00 | 0.00 |
| much less | 0.64% | 0.61 | 0.78 |
| less | 1.28% | 4.23 | 2.06 |
| the same | 30.13% | 21.51 | 4.64 |
| more | 46.79% | 0.63 | 0.79 |
| much more | 21.15% | 25.83 | 5.08 |
| Positivity Rating | 43.27% | 29.25 | 5.41 |
Question 21: Do you feel more or less concern for the environment?
| Option | Average | Variance | St. Deviation |
| no answer | 0.65% | 0.63 | 0.79 |
| much less | 1.29% | 0.86 | 0.93 |
| less | 0.65% | 1.06 | 1.03 |
| the same | 54.84% | 51.81 | 7.20 |
| more | 38.71% | 3.59 | 1.90 |
| much more | 4.52% | 12.70 | 3.56 |
| Positivity Rating | 22.40% | 10.03 | 3.17 |
Question 22: Are you more or less likely to take things for granted?
| Option | Average | Variance | St. Deviation |
| no answer | 0.65% | 0.63 | 0.79 |
| much less | 12.90% | 16.36 | 4.05 |
| less | 49.68% | 83.44 | 9.13 |
| the same | 27.74% | 33.10 | 5.75 |
| more | 9.03% | 10.09 | 3.18 |
| much more | 0.65% | 1.06 | 1.03 |
| Positivity Rating | 32.79% | 19.07 | 4.37 |
Question 23: Do you feel you know more or less about your faith?
| Option | Average | Variance | St. Deviation |
| no answer | 0.65% | 0.63 | 0.79 |
| much less | 1.29% | 1.00 | 1.00 |
| less | 0.00% | 0.00 | 0.00 |
| the same | 11.61% | 28.09 | 5.30 |
| more | 58.06% | 69.62 | 8.34 |
| much more | 29.03% | 38.13 | 6.17 |
| Positivity Rating | 57.14% | 35.57 | 5.96 |
Question 24: Would you say your faith is more or less strong?
| Option | Average | Variance | St. Deviation |
| no answer | 0.65% | 0.63 | 0.79 |
| much less | 1.29% | 1.00 | 1.00 |
| less | 1.94% | 3.19 | 1.79 |
| the same | 16.13% | 47.36 | 6.88 |
| more | 50.97% | 42.24 | 6.50 |
| much more | 29.68% | 5.91 | 2.43 |
| Positivity Rating | 53.25% | 56.40 | 7.51 |
Question 25: Is the church more or less important to you?
| Option | Average | Variance | St. Deviation |
| no answer | 0.65% | 0.63 | 0.79 |
| much less | 1.29% | 1.00 | 1.00 |
| less | 0.65% | 0.63 | 0.79 |
| the same | 39.35% | 52.63 | 7.25 |
| more | 46.45% | 29.32 | 5.41 |
| much more | 12.26% | 6.74 | 2.60 |
| Positivity Rating | 34.09% | 33.79 | 5.81 |
Question 26: Do you feel more or less close to God?
| Option | Average | Variance | St. Deviation |
| no answer | 0.65% | 0.63 | 0.79 |
| much less | 1.29% | 1.00 | 1.00 |
| less | 0.00% | 0.00 | 0.00 |
| the same | 25.16% | 34.65 | 5.89 |
| more | 47.74% | 211.76 | 14.55 |
| much more | 25.81% | 91.17 | 9.55 |
| Positivity Rating | 48.70% | 23.60 | 4.86 |
Question 27: Do you feel more or less like praying?
| Option | Average | Variance | St. Deviation |
| no answer | 0.65% | 0.63 | 0.79 |
| much less | 1.94% | 3.19 | 1.79 |
| less | 0.65% | 1.06 | 1.03 |
| the same | 38.06% | 4.74 | 2.18 |
| more | 43.23% | 7.57 | 2.75 |
| much more | 16.13% | 4.81 | 2.19 |
| Positivity Rating | 35.71% | 35.92 | 5.99 |
Question 28: Do you feel you are more or less religious?
| Option | Average | Variance | St. Deviation |
| no answer | 0.65% | 0.63 | 0.79 |
| much less | 1.29% | 1.00 | 1.00 |
| less | 1.29% | 0.86 | 0.93 |
| the same | 32.26% | 24.62 | 4.96 |
| more | 48.39% | 11.73 | 3.43 |
| much more | 16.77% | 20.45 | 4.52 |
| Positivity Rating | 39.29% | 29.16 | 5.40 |
Question 29: Do you feel you are more or less embarrassed about your religion?
| Option | Average | Variance | St. Deviation |
| no answer | 0.65% | 0.63 | 0.79 |
| much less | 16.13% | 22.20 | 4.71 |
| less | 36.77% | 9.33 | 3.05 |
| the same | 38.71% | 10.38 | 3.22 |
| more | 5.16% | 4.04 | 2.01 |
| much more | 3.23% | 3.98 | 1.99 |
| Positivity Rating | 28.90% | 52.95 | 7.28 |
Question 30: Do you value working in a team more or less?
| Option | Average | Variance | St. Deviation |
| no answer | 0.65% | 0.63 | 0.79 |
| much less | 0.00% | 0.00 | 0.00 |
| less | 1.29% | 0.86 | 0.93 |
| the same | 8.39% | 2.04 | 1.43 |
| more | 56.77% | 135.41 | 11.64 |
| much more | 33.55% | 172.72 | 13.14 |
| Positivity Rating | 61.69% | 49.40 | 7.03 |
Question 31: Do you value listening to others more or less?
| Option | Average | Variance | St. Deviation |
| no answer | 0.65% | 0.63 | 0.79 |
| much less | 0.00% | 0.00 | 0.00 |
| less | 0.65% | 1.06 | 1.03 |
| the same | 13.55% | 42.74 | 6.54 |
| more | 60.65% | 35.61 | 5.97 |
| much more | 25.16% | 147.67 | 12.15 |
| Positivity Rating | 55.52% | 77.87 | 8.82 |
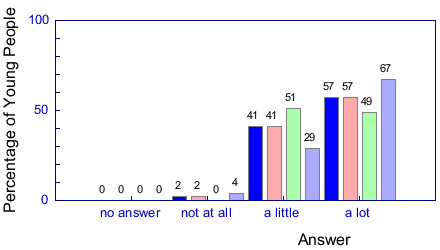
Question 32: Do you feel you have learnt more about yourself?
| Option | Average | Variance | St. Deviation |
| no answer | 0.00% | 0.00 | 0.00 |
| not at all | 1.92% | 2.81 | 1.68 |
| a little | 41.03% | 83.70 | 9.15 |
| a lot | 57.05% | 56.08 | 7.49 |
| Positivity Rating | 77.56% | 8.52 | 2.92 |
Question 33: Do you value yourself more?
| Option | Average | Variance | St. Deviation |
| no answer | 0.65% | 0.63 | 0.79 |
| not at all | 9.68% | 0.45 | 0.67 |
| a little | 59.35% | 12.18 | 3.49 |
| a lot | 30.97% | 12.08 | 3.48 |
| Positivity Rating | 61.04% | 4.88 | 2.21 |
Question 34: Have you felt a sense of achievement this week?
| Option | Average | Variance | St. Deviation |
| no answer | 0.00% | 0.00 | 0.00 |
| not at all | 3.21% | 0.61 | 0.78 |
| a little | 28.85% | 28.38 | 5.33 |
| a lot | 67.95% | 37.33 | 6.11 |
| Positivity Rating | 82.37% | 11.88 | 3.45 |
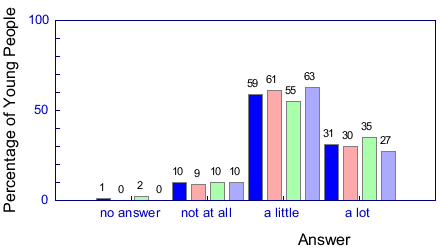
Question 35: Do you feel you have changed?
| Option | Average | Variance | St. Deviation |
| no answer | 0.00% | 0.00 | 0.00 |
| not at all | 6.41% | 16.34 | 4.04 |
| a little | 55.77% | 106.09 | 10.30 |
| a lot | 37.82% | 39.72 | 6.30 |
| Positivity Rating | 65.71% | 1.51 | 1.23 |
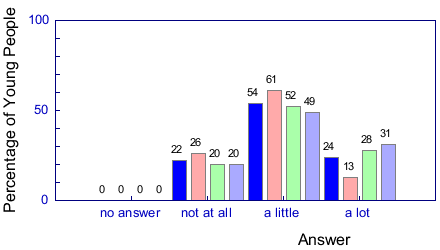
Question 36: Have your priorities in life changed?
| Option | Average | Variance | St. Deviation |
| no answer | 0.00% | 0.00 | 0.00 |
| not at all | 21.79% | 8.28 | 2.88 |
| a little | 53.85% | 24.98 | 5.00 |
| a lot | 24.36% | 59.82 | 7.73 |
| Positivity Rating | 51.28% | 27.81 | 5.27 |
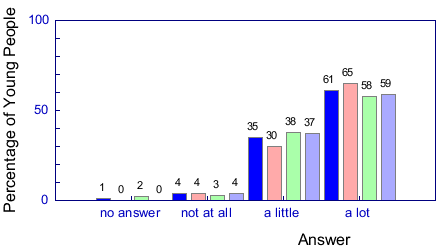
Question 37: Have you learnt how to get on with people better?
| Option | Average | Variance | St. Deviation |
| no answer | 0.65% | 0.63 | 0.79 |
| not at all | 3.87% | 0.19 | 0.43 |
| a little | 35.48% | 11.73 | 3.42 |
| a lot | 60.65% | 9.46 | 3.08 |
| Positivity Rating | 78.90% | 1.39 | 1.18 |
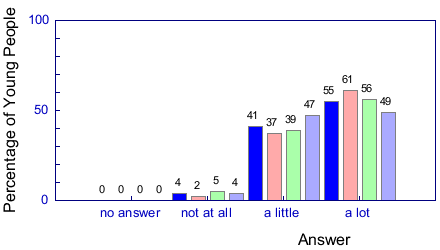
Question 38: Have you learnt about how to make new friends?
| Option | Average | Variance | St. Deviation |
| no answer | 0.00% | 0.00 | 0.00 |
| not at all | 3.85% | 1.33 | 1.15 |
| a little | 41.03% | 18.12 | 4.26 |
| a lot | 55.13% | 23.71 | 4.87 |
| Positivity Rating | 75.64% | 7.99 | 2.83 |
Question 39: Do you feel differently about the world you live in?
| Option | Average | Variance | St. Deviation |
| no answer | 0.00% | 0.00 | 0.00 |
| not at all | 8.97% | 3.65 | 1.91 |
| a little | 60.90% | 7.54 | 2.75 |
| a lot | 30.13% | 21.51 | 4.64 |
| Positivity Rating | 60.58% | 10.69 | 3.27 |
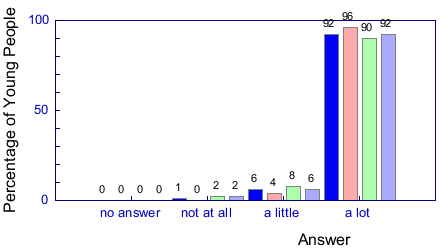
| Option | Average | Variance | St. Deviation |
| no answer | 0.00% | 0.00 | 0.00 |
| not at all | 1.28% | 0.78 | 0.88 |
| a little | 6.41% | 2.51 | 1.58 |
| a lot | 92.31% | 5.33 | 2.31 |
| Positivity Rating | 95.51% | 2.43 | 1.56 |
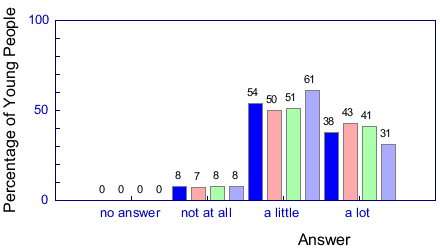
Question 41: Did you feel challenged this week?
| Option | Average | Variance | St. Deviation |
| no answer | 0.00% | 0.00 | 0.00 |
| not at all | 7.69% | 0.62 | 0.78 |
| a little | 53.85% | 26.13 | 5.11 |
| a lot | 38.46% | 31.05 | 5.57 |
| Positivity Rating | 65.38% | 9.30 | 3.05 |