A Quantitative Analysis of the Effects of a Residential Experience
Research carried out at Castlerigg Manor in the summer term of 2008
Data relating to Question 11:
Are you more or less self-conscious?
Grouping(s)
Answers
| Pie Chart | Positivity | no answer | much less | less | the same | more | much more | |
| Average | 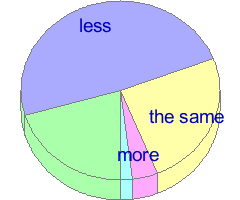 | 19.55% | 0.00% | 8.97% | 40.38% | 34.62% | 12.82% | 3.21% |
| Sample A | | 15.22% | 0.00% | 6.52% | 43.48% | 30.43% | 13.04% | 6.52% |
| Sample B | | 5.74% | 0.00% | 1.64% | 31.15% | 45.90% | 19.67% | 1.64% |
| Sample C | | 40.82% | 0.00% | 20.41% | 48.98% | 24.49% | 4.08% | 2.04% |
Consistency
Answer Correlation Data
- Other answers given by the 8.97% who answered ‘much less’
- Other answers given by the 40.38% who answered ‘less’
- Other answers given by the 34.62% who answered ‘the same’
- Other answers given by the 12.82% who answered ‘more’
- Other answers given by the 3.21% who answered ‘much more’
Coefficients of Determination between this and other Questions
| Coefficient of Determination | Question | |
| 10.24% | Q22 | Are you more or less likely to take things for granted? |
| 7.24% | Q12 | Do you respect others more or less? |
| 6.18% | Q13 | Do you value others more or less? |
| 5.47% | Q10 | Are you more or less trusting of others? |
| 5.41% | Q16 | Do you value spending time with others more or less? |