A Quantitative Analysis of the Effects of a Residential Experience
Research carried out at Castlerigg Manor in the summer term of 2008
Data relating to Question 29:
Do you feel you are more or less embarrassed about your religion?
Grouping(s)
Answers
| Pie Chart | Positivity | no answer | much less | less | the same | more | much more | |
| Average | 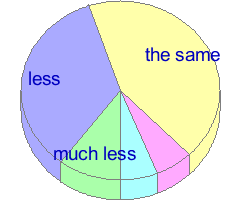 | 28.90% | 0.65% | 16.13% | 36.77% | 38.71% | 5.16% | 3.23% |
| Sample A | | 32.61% | 0.00% | 15.22% | 41.30% | 39.13% | 2.17% | 2.17% |
| Sample B | | 34.75% | 1.67% | 21.67% | 35.00% | 35.00% | 6.67% | 1.67% |
| Sample C | | 18.37% | 0.00% | 10.20% | 34.69% | 42.86% | 6.12% | 6.12% |
Consistency
Answer Correlation Data
- Other answers given by the 16.13% who answered ‘much less’
- Other answers given by the 36.77% who answered ‘less’
- Other answers given by the 38.71% who answered ‘the same’
- Other answers given by the 5.16% who answered ‘more’
- Other answers given by the 3.23% who answered ‘much more’
Coefficients of Determination between this and other Questions
| Coefficient of Determination | Question | |
| 5.97% | Q34 | Have you felt a sense of achievement this week? |
| 5.35% | Q16 | Do you value spending time with others more or less? |