A Quantitative Analysis of the Effects of a Residential Experience
Research carried out at Castlerigg Manor in the summer term of 2008
Data relating to Question 41:
Did you feel challenged this week?
Grouping(s)
Answers
| Pie Chart | Positivity | no answer | not at all | a little | a lot | |
| Average | 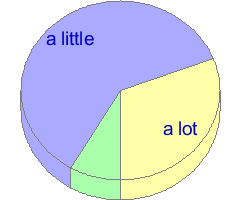 | 65.38% | 0.00% | 7.69% | 53.85% | 38.46% |
| Sample A | | 68.48% | 0.00% | 6.52% | 50.00% | 43.48% |
| Sample B | | 66.39% | 0.00% | 8.20% | 50.82% | 40.98% |
| Sample C | | 61.22% | 0.00% | 8.16% | 61.22% | 30.61% |
Consistency
Answer Correlation Data
- Other answers given by the 7.69% who answered ‘not at all’
- Other answers given by the 53.85% who answered ‘a little’
- Other answers given by the 38.46% who answered ‘a lot’
Coefficients of Determination between this and other Questions
| Coefficient of Determination | Question | |
| 7.43% | Q34 | Have you felt a sense of achievement this week? |